Hurricane Data Collection and Analysis Summary
Two datasets were data obtained for analysis. The hurricane data was acquired from the National Hurricane Center (http://www.nhc.noaa.gov/). Note that for the hurricane statistical data, some storms occurring during the hurricane season may not have been actual hurricanes, but were included in the frequency calculations. The buoy data was downloaded from the NOAA National Data Buoy Center website (http://www.ndbc.noaa.gov/). Data was collected from ten states – Maine, Massachusetts, New Hampshire, New York, New Jersey, Virginia, North Carolina, South Carolina, Georgia, and Florida. Only data collected during the hurricane season for each year was extracted and used. Yearly and monthly frequencies of storm-force waves during the hurricane season were calculated. Also, linear regressions were run to see if any trends were prevalent in the data. Return intervals for each hurricane category was found and interpreted from the following NHC site (http://www.nhc.noaa.gov/pastprofile.shtml). For the purposes of this website, three states were used, Florida, North Carolina and New Hampshire, to represent three sections of the Atlantic Coast – southern, middle, and northern. The complete data sets can found here.
|
|
|
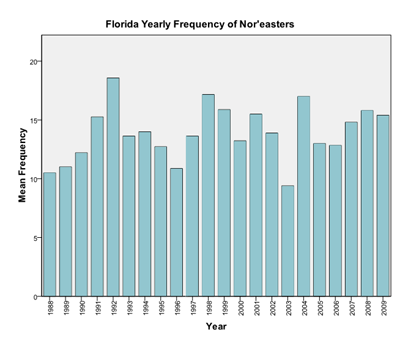
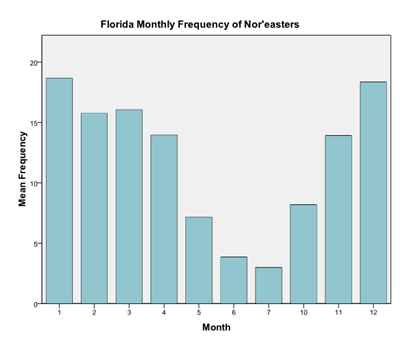
 The buoy data for Florida illustrates the hurricane season well. There are a few storm occurrences early in the season, while the bulk of the storms move into the southern region as the ocean waters warm up over the summer reaching a maximum frequency in October. Then, as the waters cool during the early part of winter, the frequency of storm sized waves decreases. The yearly data is interesting in that it shows an increase in the number of storm events from the early 1990’s to the early 2000’s, but a marked decrease in events over the past couple of years, with the fewest amount coming in 2009.

|
 This regression was created using the Statistical Package for the Social Sciences (SPSS). These analyses looked at the wave heights of storms during the hurricane season over time in Florida. The model summary and ANOVA test show that there is no significant trend in the data (significance value of 0.365).
|
|
|
 The North Carolina data, representing the Mid-Atlantic region, also displays the hurricane season period accurately. In the late months of spring and early months of summer, there are a few storm events since the ocean water has not warmed very much. By the months of September and October, the waters are very warm, producing a lot of storms, evident by the peaks in frequency during these months. Once again, as the waters cool late in the fall and early winter, the frequency of storm events decreases. Unlike the Florida data, the North Carolina data shows no real trend in the yearly frequencies. There are several peaks and valleys throughout the course of record. Interestingly, the North Carolina data does not show the same low frequency of storm events in 2009 as the Florida data demonstrated.

|
 The regression, found using SPSS, shows no trend in the data when analyzing the wave heights of storms during the hurricane season over time (significance value of 0.983). There was too much variability in the North Carolina data for there to be a significant trend.
|
|
|
 The last region we analyzed was the Northern region represented by the New Hampshire data. The data shows a few storm occurrences in the late months of spring and early months of summer because of cool ocean waters. Since the ocean water warms up slightly slower than land due to the different heat capacities, the water is extremely warm by the September and October. These warm waters spark more storms, evident by the peaks in frequency during these months in the figures above. As the waters cool late in the fall and early winter, the frequency of storm events decreases. Just like the North Carolina data, the New Hampshire data shows no real trend in the yearly frequencies of storm events. There are several peaks and valleys throughout the course of record. Also, the New Hampshire data does not show the same low frequency of storm events in 2009 as the Florida data displayed, and is more like the data from North Carolina in this respect.

|
 To study wave heights of storms during the hurricane season over time, a regression analysis using SPSS was performed. This analysis indicates no trend in the data (significance value of 0.974). As with the North Carolina data, there was too much variability in the New Hampshire data for there to be a significant trend.
|
Nor'Easter Data Collection and Analysis Summary The data obtained for analysis was downloaded from the NOAA National Data Buoy Center website (http://www.ndbc.noaa.gov/). Data was collected from ten states – Maine, Massachusetts, New Hampshire, New York, New Jersey, Virginia, North Carolina, South Carolina, Georgia, and Florida. The archived data dated back more than 20 years. To ensure that only data pertaining to nor’easters was used in analysis, the data collected during the hurricane season for each year was extracted. Yearly and monthly frequencies of nor’easter events were calculated. Also, linear regressions were run to see if any trends were prevalent in the data. For the purposes of this website, the three states with the most complete data set were used for visual analysis, Florida, North Carolina, and New Hampshire. These states represent three sections of the Atlantic coast – southern, middle, and northern. The complete data sets for the three states can found here: South Carolina, Maine, New Jersey.
|
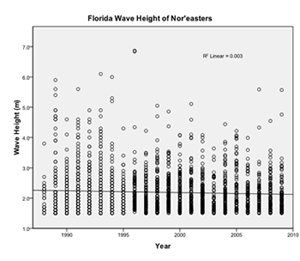
 This regression was created using the Statistical Package for the Social Sciences (SPSS). These analyses looked at the wave heights of nor’easters over time. The model summary and ANOVA test show that there is a significant trend in the data (significance value of 0.018), and the regression line shows an overall decrease in the wave height of the storms, suggesting a weakening of the overall strength of nor’easters in Florida.
|
|
|
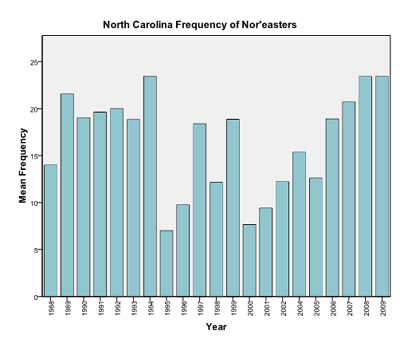
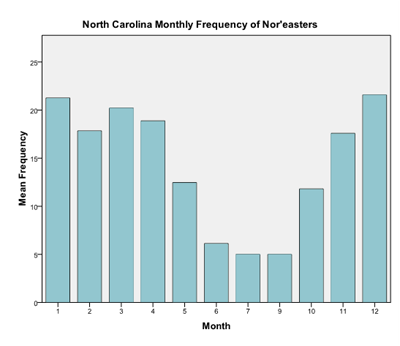
 The data set for North Carolina, spanning from 1988 to 2009, was used to study the mid-Atlantic Coast. Once again, the monthly frequency data shows the seasonality of nor’easters explained earlier. There is no one month that has a drastically higher frequency than any other months. However the yearly data shows different results than the data from Florida. The years of 1994, 2008, and 2009 saw very high frequencies of nor’easters, while there was a period between those years with relatively low frequencies, with the exception of 1997 and 1999. The year 1995 had the lowest frequency of nor’easters.

|
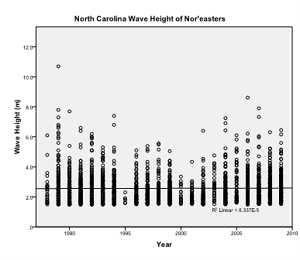
 A regression analysis using SPSS looked at the wave heights of nor’easters over time in North Carolina. The model summary and ANOVA test show that there is no significant trend in the data (significance value of 0.659), and the regression line shows no clear trend in the data. If the data set were expanded to include more years, a significant trend might be found.
|
|
|
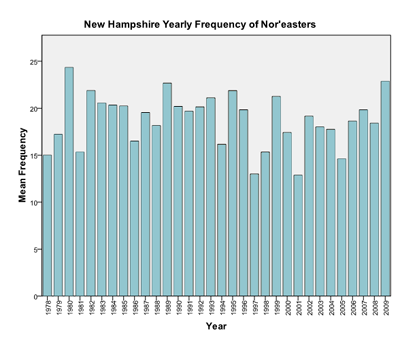
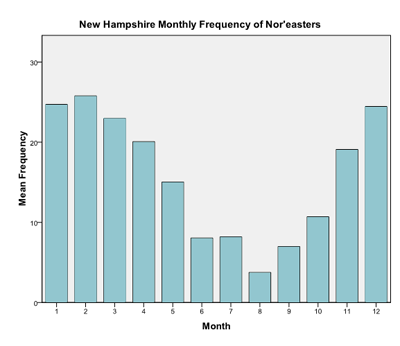
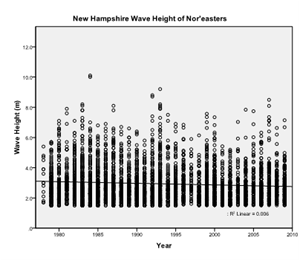 Finally, the data from New Hampshire, which spans from 1979 to 2009, was implemented for the northern section of the Atlantic Coast. As stated above, the seasonality of nor’easters is clearly delineated from the monthly frequency plot. It should be noted though that the scale was slightly increased, likely because this buoy is much further north than the other two regions, leading to more nor’easter events. The yearly data fluctuates greatly, with the lowest frequency in 1997 and 2001 and the highest frequency in 1980.

|
 A regression analysis of wave heights of nor’easters over time was performed using SPSS. The model summary and ANOVA test show that there is a highly significant trend in the data (significance value of 0.000). The regression line indicates a slight decrease in the wave heights of nor’easters over time, suggesting again an overall decrease in the intensity of the nor’easters in the New Hampshire area.


