

Richard Seaman.
Nor'Easters are powerful Atlantic storms which cause severe damage and change to the entire coastline. Hurricanes are driven by warm summer oceans and atmospheric convection, and can have a lifetime of up to a week. However, they often only last up to a few hours over any single area. They are well-known to the public as their intensity often causes billions of dollars worth of damage to people and the environment. Nor’easters, the often less publicized Atlantic coastal storm type, can have a similar if not stronger impact than hurricanes. This is because they are often larger than hurricanes and last longer over any given area. typical hurricane season is from May to November whereas the typical Nor’easter season is from December to April.

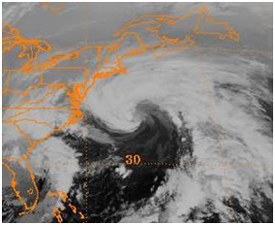
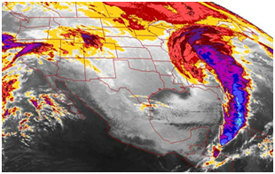
Nor’easters are extratropical cyclonic storms that move along the North American east coast. The name “nor’easter” refers to the strong winds that blow from the northeast ahead of the storm over coastal areas. These storms can develop any time of the year, but most frequently form with peak intensity between September and April. The stretch of coastline between Georgia and New Jersey up to 100 miles inland is the typical development area of these storms. Unlike their devastating cousins, tropical cyclones, nor’easters form in the mid-latitudes and have cold cores. They can also be much larger storms, reaching diameters up to 1,000 miles across, and can move at a much slower pace.
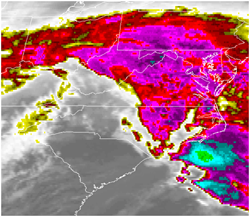
These storms usually take a north or northeastward track following their development, intensifying along the way due to the temperature difference between the cold Arctic air transported across the U.S. by the polar jet and the warm air moving northward from the Gulf of Mexico and Atlantic Ocean. The counter-clockwise flow around this low pressure system brings the warm moist oceanic air over land.

This air collides with the cold air carried southward by the trough of the jet stream. The intensifying low spirals the different air masses toward each other at a faster rate due to the enhanced pressure gradient. The greater the temperature differences between the two air masses, the greater the turbulence and instability can become, leading to the production of stronger, more severe coastal storms.
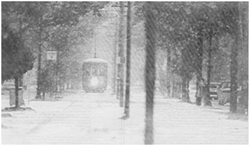
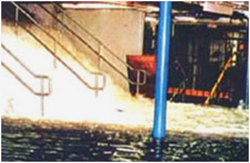
Nor’easters usually reach their peak intensity near New England and the Canadian Maritime Provinces. The impacts of these storms in these regions and along the rest of the East Coast include heavy snow, persistent gale force winds, rough seas, coastal flooding and beach erosion. In order to help with storm forecasting and potential coastal impacts, the Dolan-Davis classification scale, based on wave height and wave power index, is used to classify these storms on an intensity scale from 1 (weak) to 5 (extreme) that also gauges potential erosion effects and property damage. Proper warning and informative reporting of the intensity and potential impacts of these storms can allow for effective and timely preparation for these debilitating phenomena.
The Dolan-Davis Scale
The Dolan-Davis classification system for Nor’easters was developed to complement the Saffir-Simpson scale used for hurricanes.

http://www.aoml.noaa.gov/hrd/tcfaq/D1.html
Williams, J. (2005, May 17). Hurricane scale invented to communicate storm danger.
Retrieved from http://www.usatoday.com/weather/hurricane/whscale.htm
These storms don’t typically receive as much attention as hurricanes, yet quite often can be more devastating. The scale is based on mean wave height caused by the Nor’easter – different from the Saffir-Simpson classification of hurricanes based on wind speed. The scale was developed using data from 1,347 Nor’easters over a forty year time frame. Robert Dolan and Robert Davis developed the scale to classify Nor’easters from Class I through Class V. The table below summarizes each class of storm.


